Investment

How Stocks Work

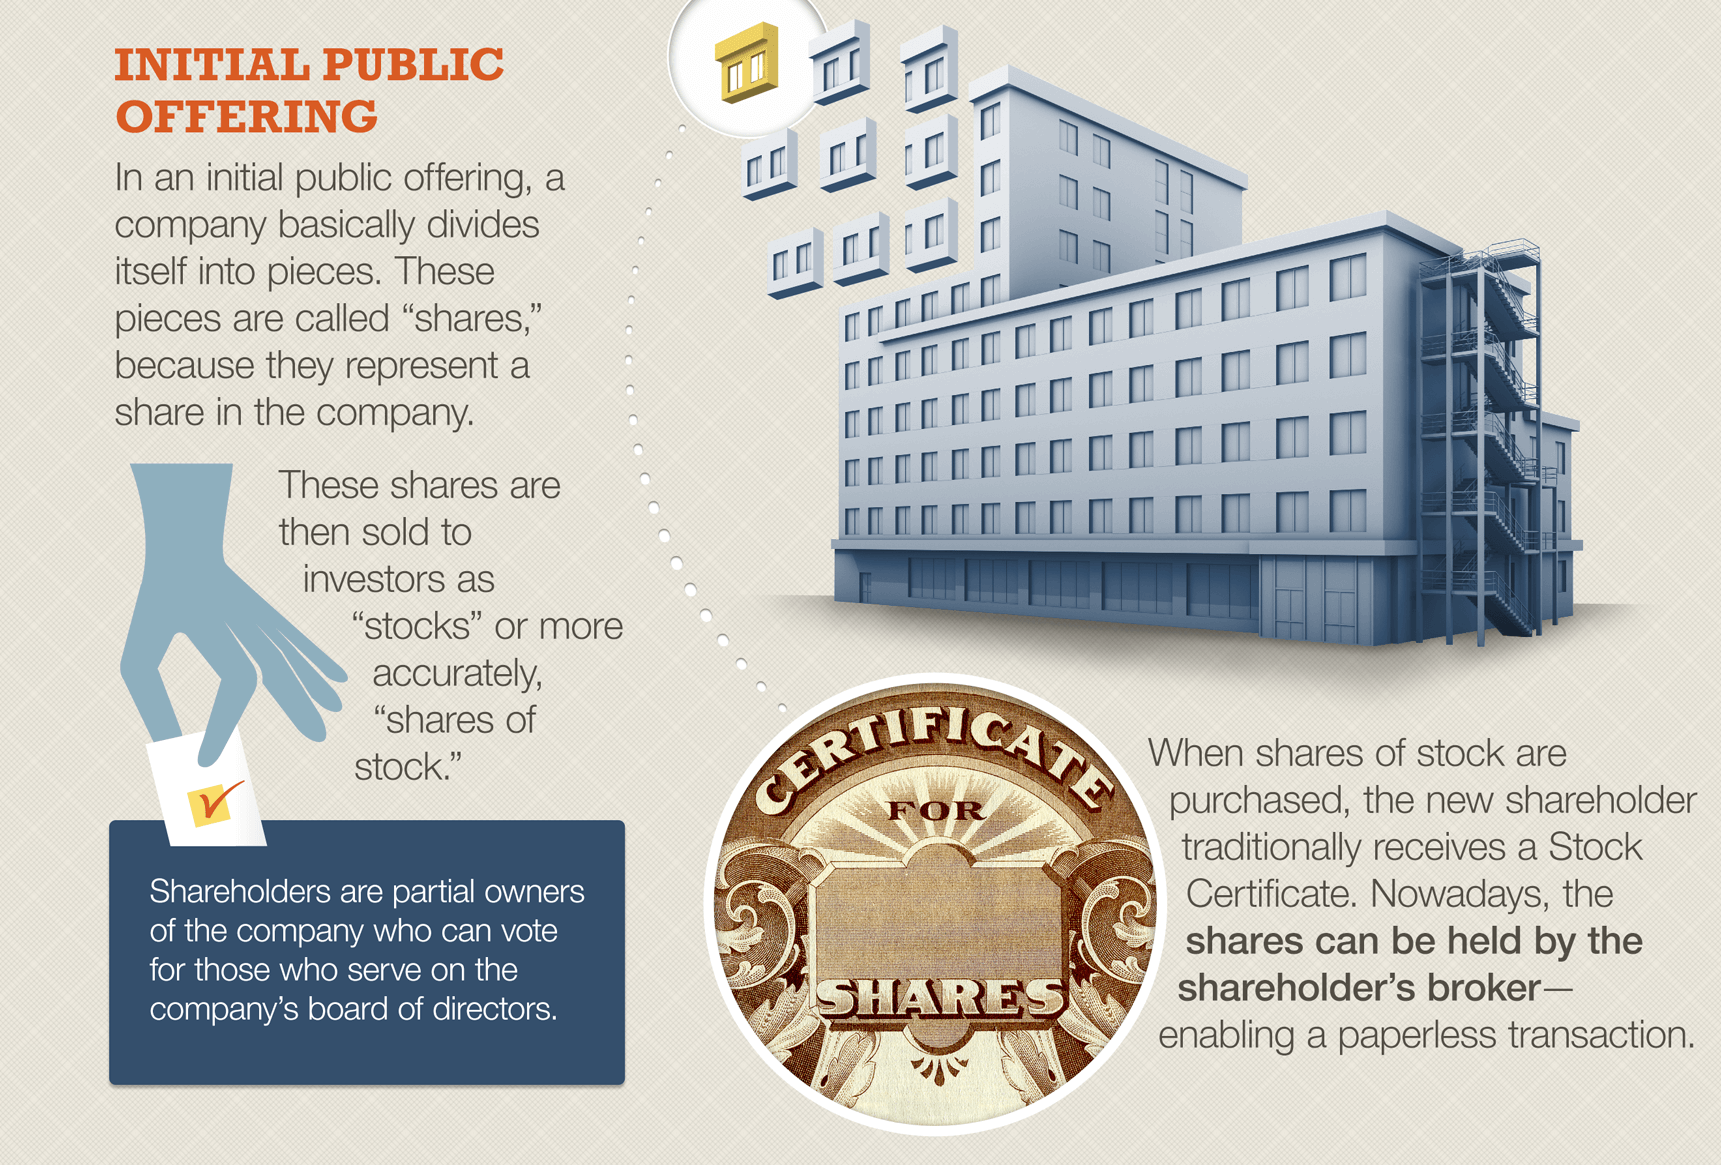
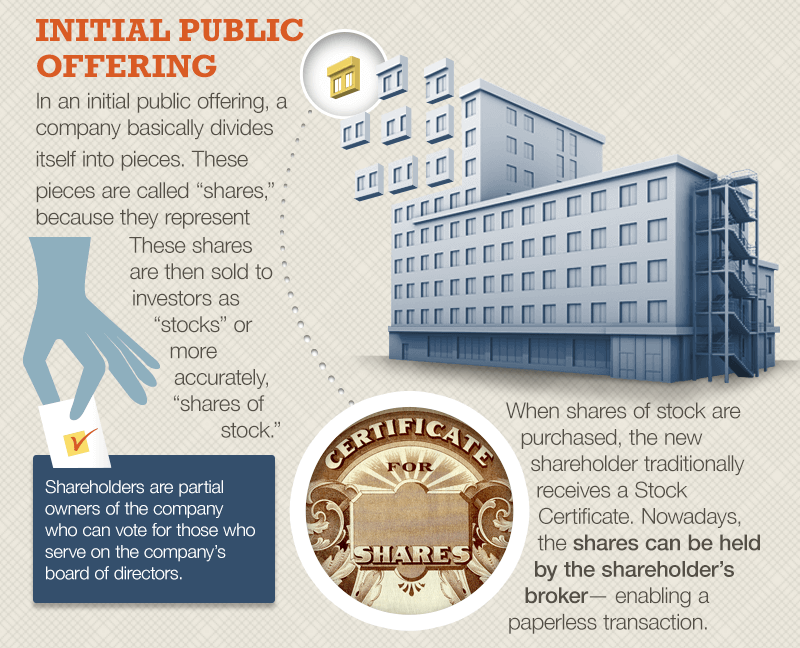
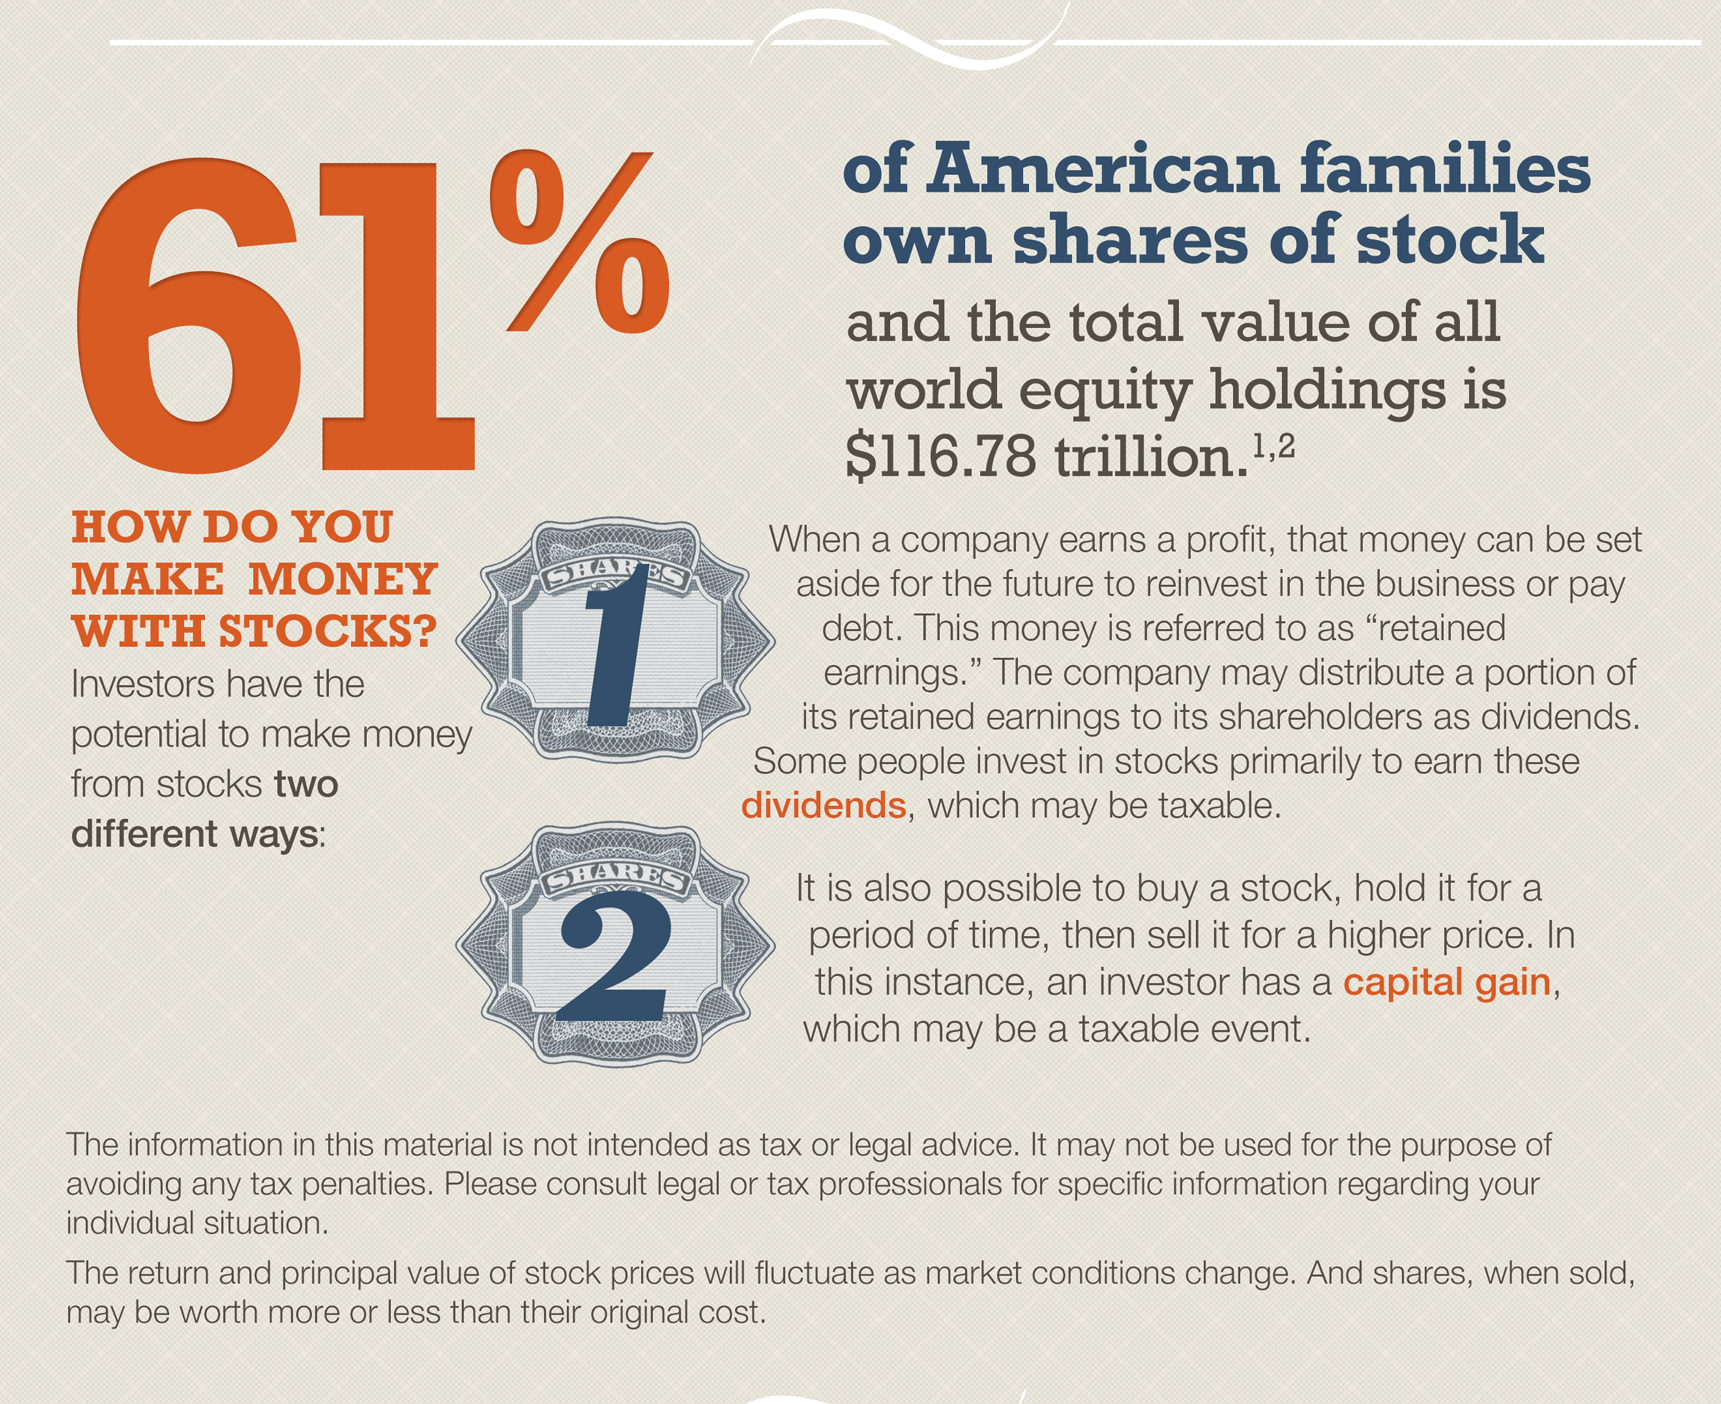
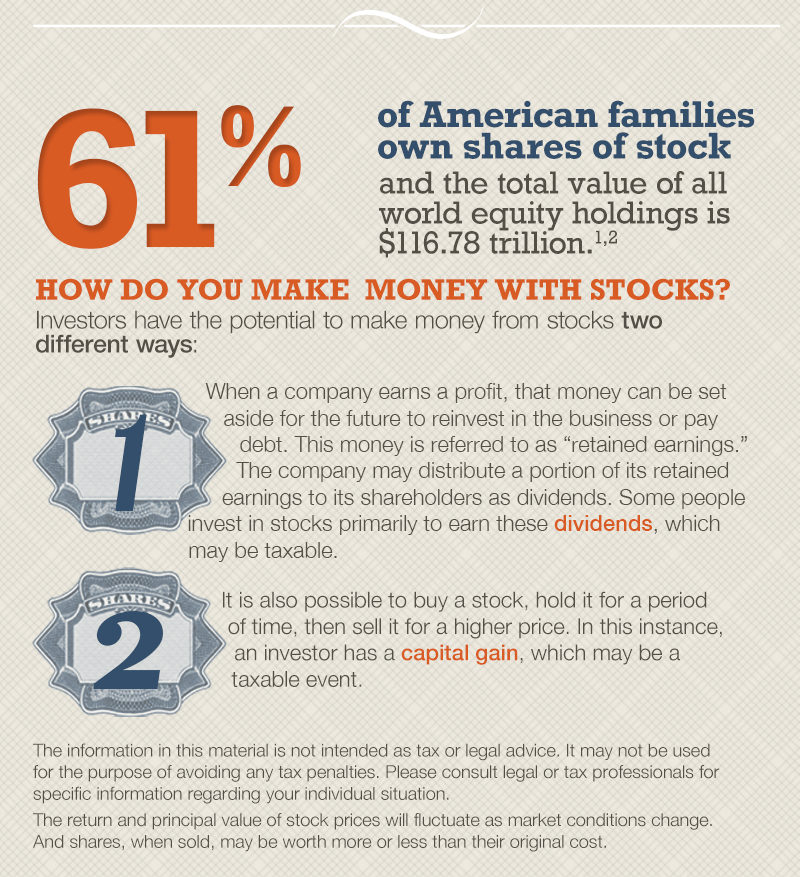
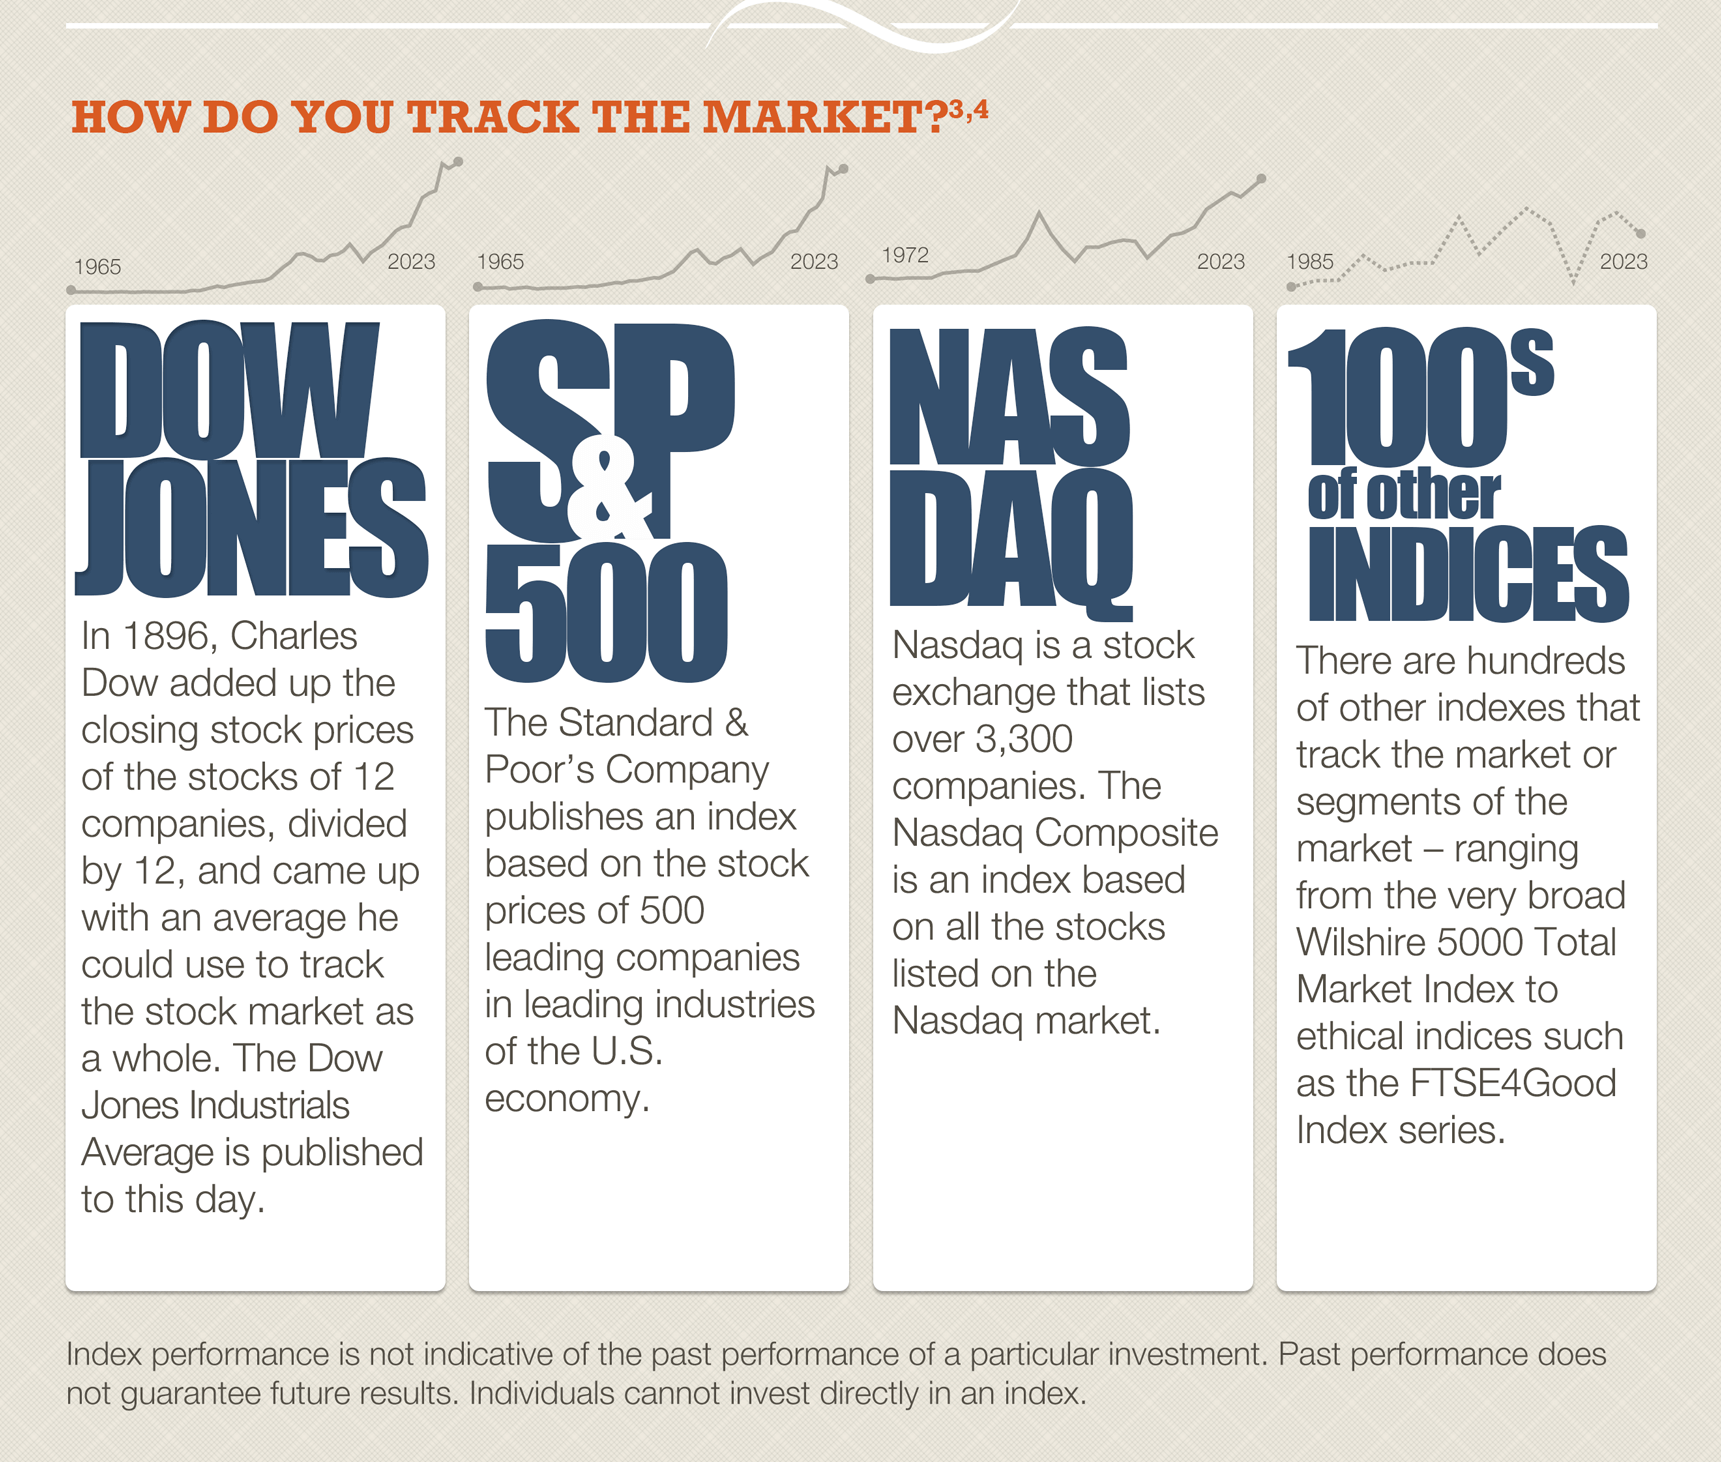
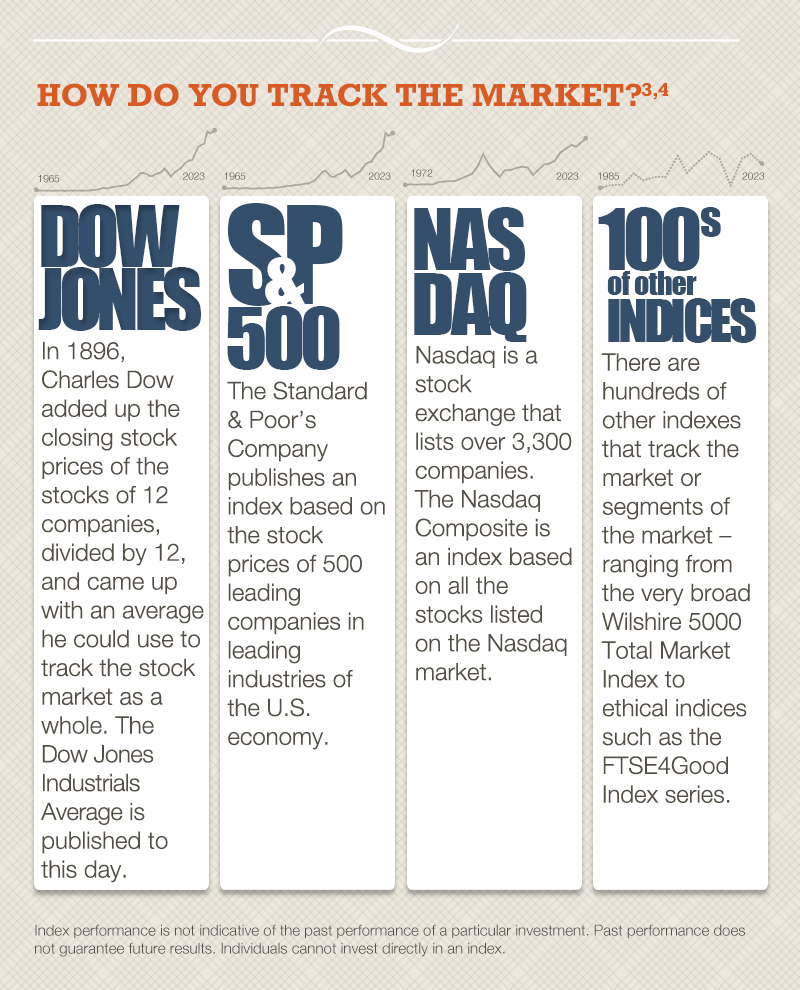
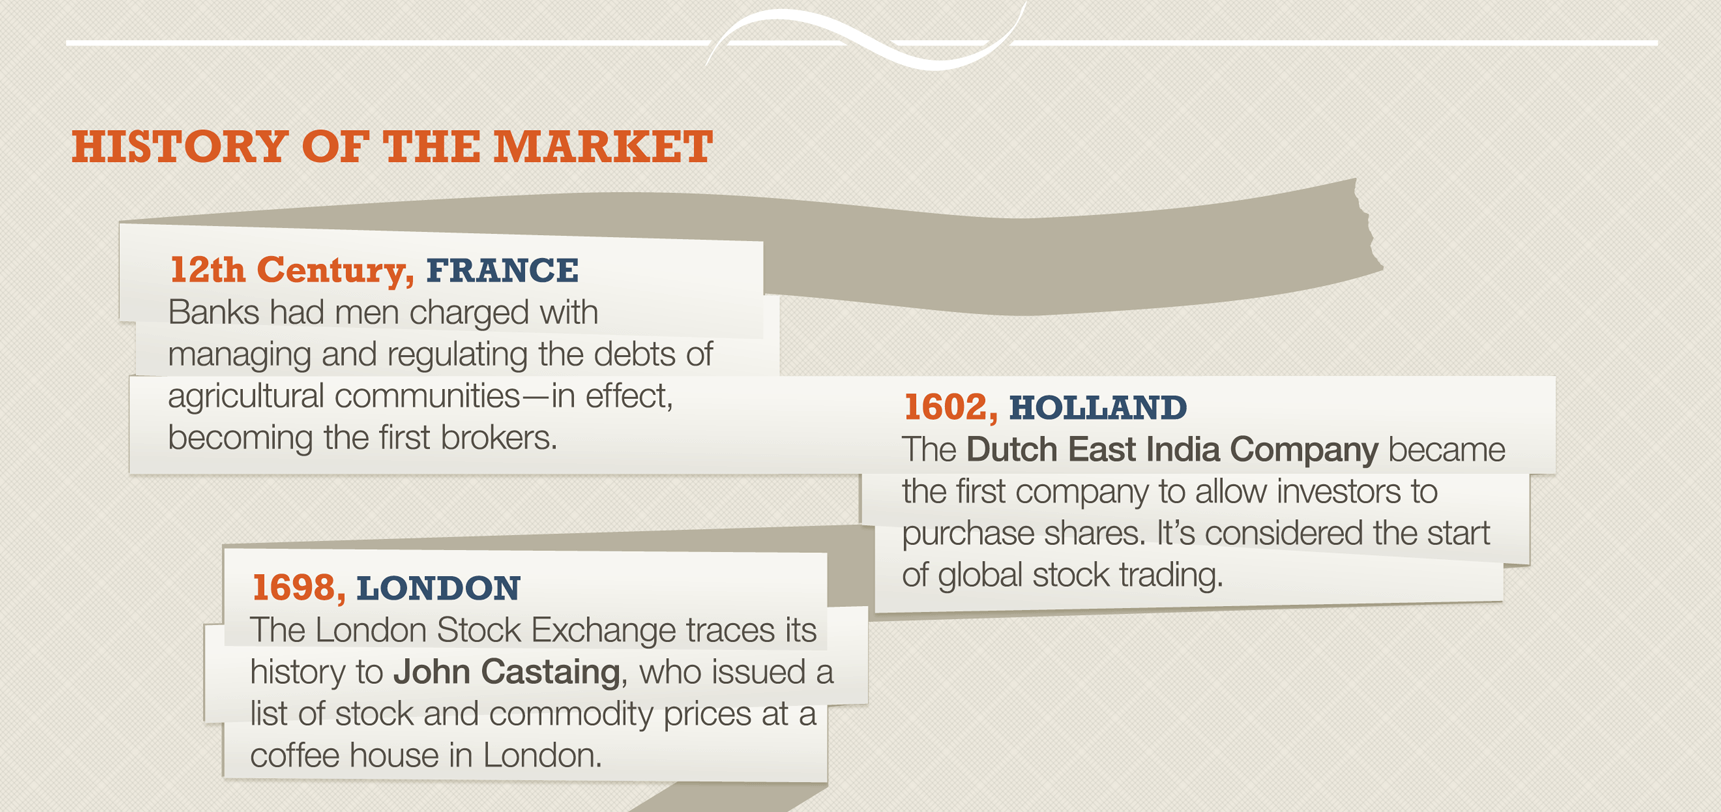
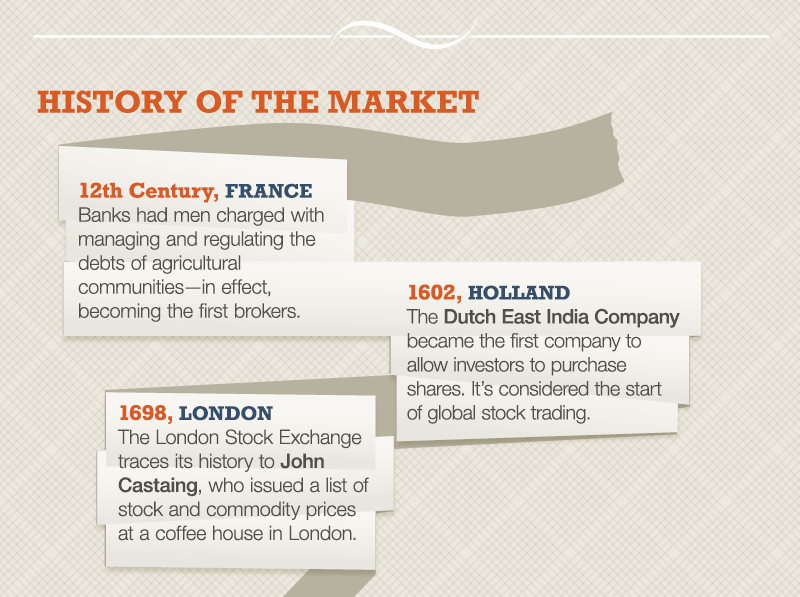
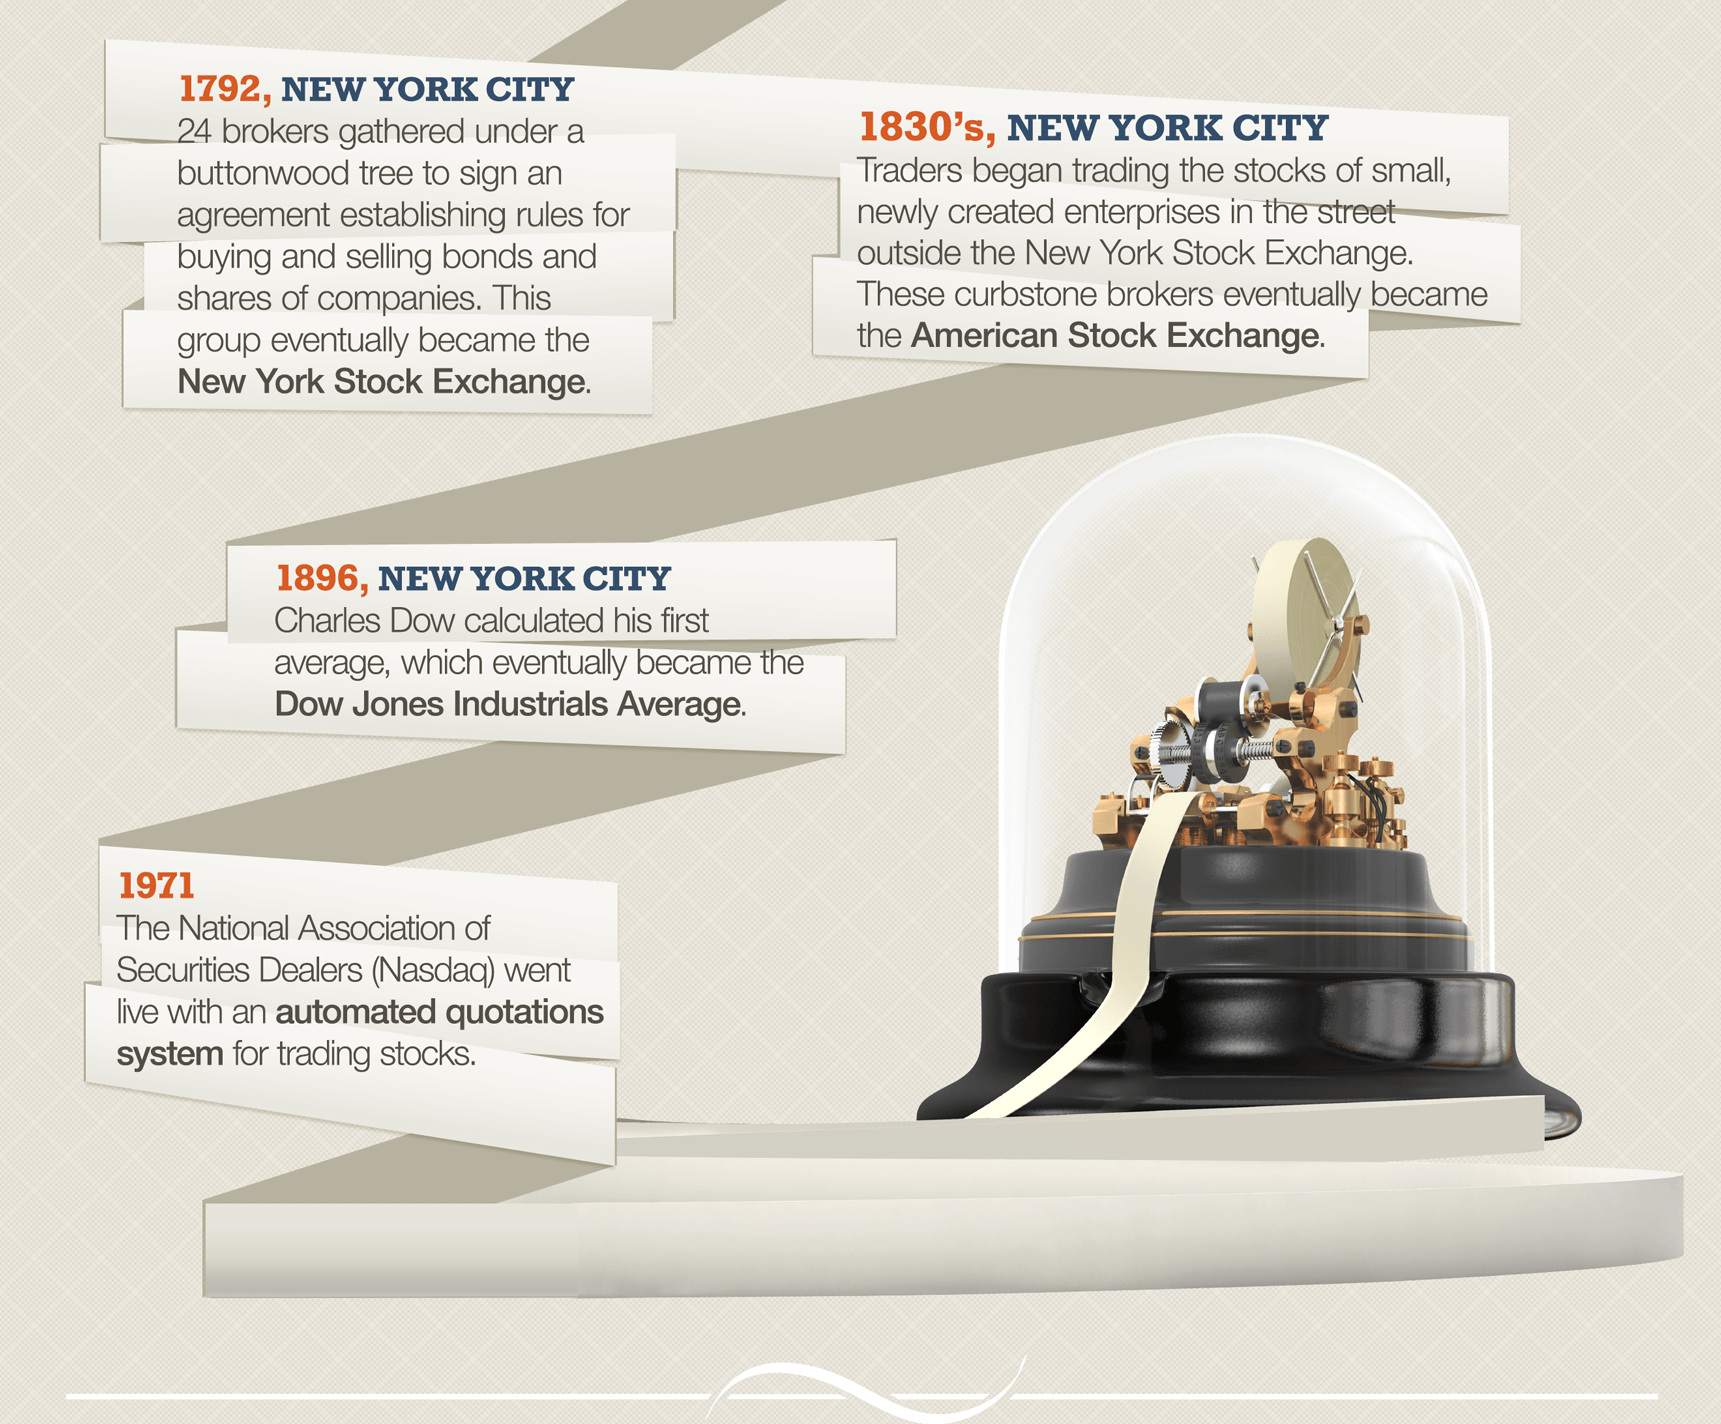
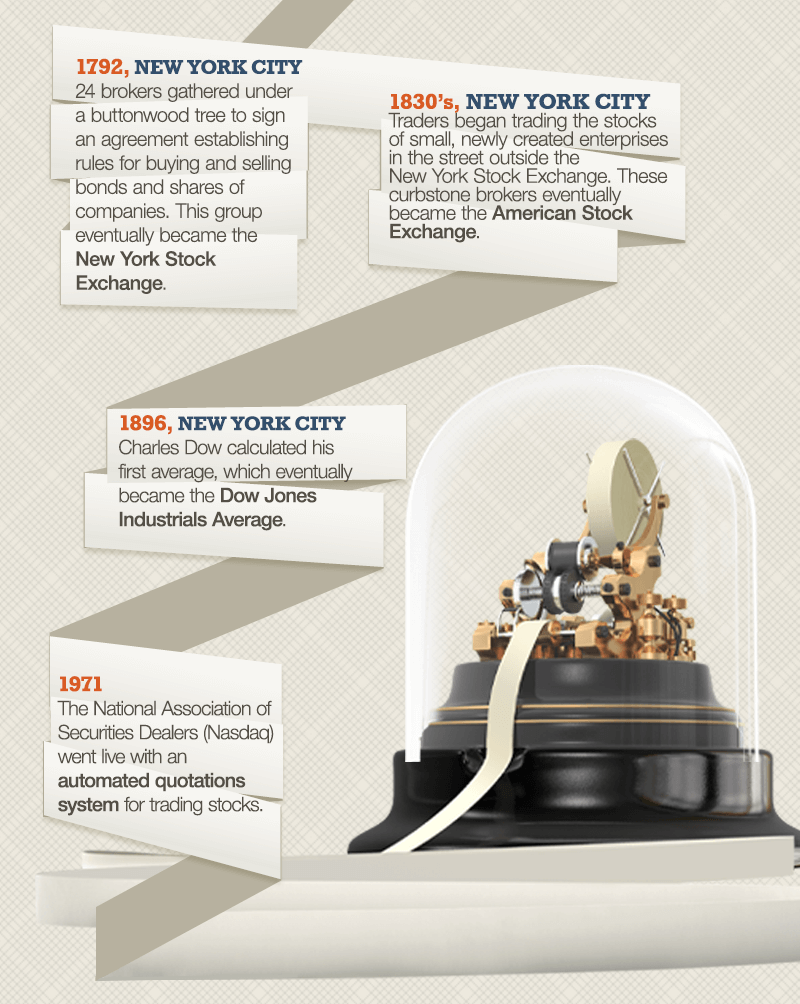
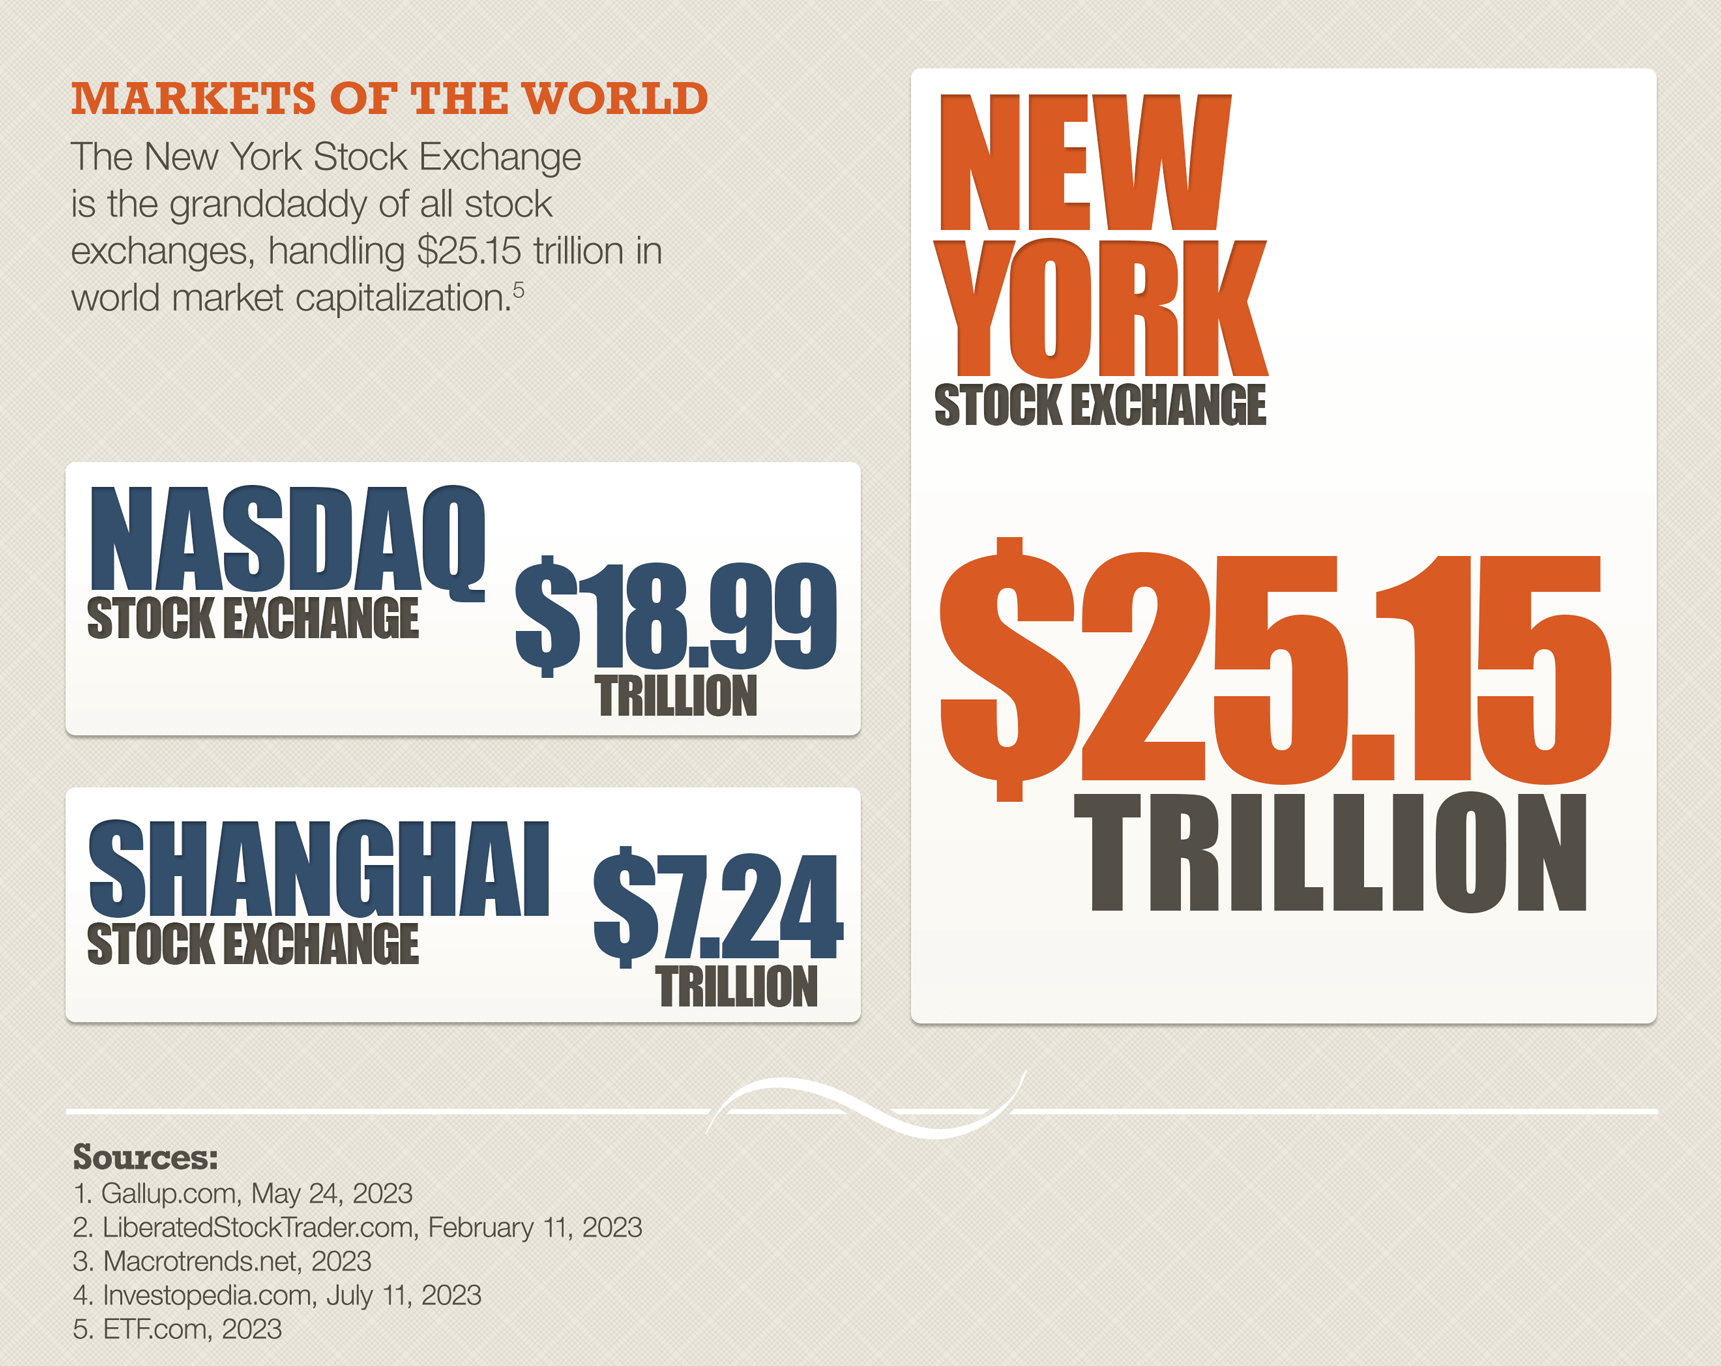
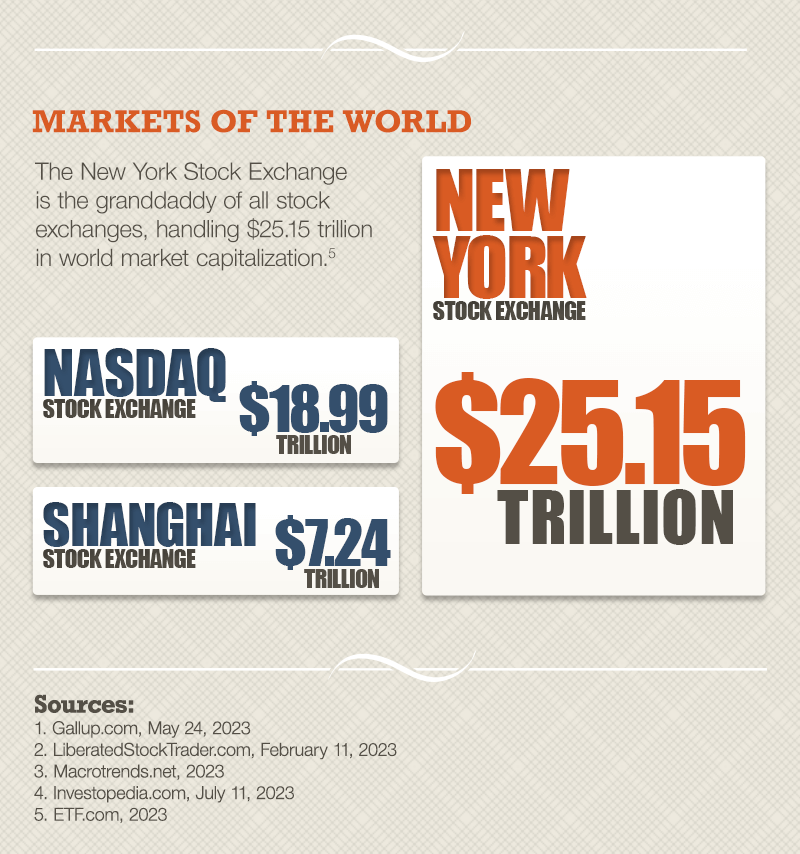
This is an educational infographic on how stocks work. It has seven sections on a blue background. The title reads: How Stocks Work.This is an educational infographic on how stocks work. It has seven sections on a blue background. The title reads: How Stocks Work.The first section, titled Initial Public Offering, explains that in an IPO a company divides itself into pieces called shares, which represent ownership in the company. These shares are then sold to investors as stocks. Shareholders are partial owners who can vote for the board of directors. Traditionally, shareholders received paper stock certificates, but today shares can be held electronically by brokers. The first section, titled Initial Public Offering, explains that in an IPO a company divides itself into pieces called shares, which represent ownership in the company. These shares are then sold to investors as stocks. Shareholders are partial owners who can vote for the board of directors. Traditionally, shareholders received paper stock certificates, but today shares can be held electronically by brokers.The second section, titled How Do You Make Money with Stocks, outlines two ways investors can potentially earn money. The first is dividends, when a company distributes a portion of retained earnings to shareholders. The second is capital gains, when a stock is bought, held, and later sold for a higher price. The section notes that dividends and capital gains may be taxable events. It notes that 61% of American families own shares of stock and that the total value of world equity holdings is $116.78 trillion.The second section, titled How Do You Make Money with Stocks, outlines two ways investors can potentially earn money. The first is dividends, when a company distributes a portion of retained earnings to shareholders. The second is capital gains, when a stock is bought, held, and later sold for a higher price. The section notes that dividends and capital gains may be taxable events. It notes that 61% of American families own shares of stock and that the total value of world equity holdings is $116.78 trillion.The third section, titled How Do You Track the Market, describes stock market indices. It explains that the Dow Jones Industrial Average began in 1896, when Charles Dow averaged the stock prices of 12 companies. The S&P 500 tracks 500 leading U.S. companies. Nasdaq is a stock exchange listing more than 3,300 companies, with the Nasdaq Composite index covering all of them. It also mentions hundreds of other indexes, such as the Wilshire 5000 and FTSE4Good, which track broad markets or specific sectors.The third section, titled How Do You Track the Market, describes stock market indices. It explains that the Dow Jones Industrial Average began in 1896, when Charles Dow averaged the stock prices of 12 companies. The S&P 500 tracks 500 leading U.S. companies. Nasdaq is a stock exchange listing more than 3,300 companies, with the Nasdaq Composite index covering all of them. It also mentions hundreds of other indexes, such as the Wilshire 5000 and FTSE4Good, which track broad markets or specific sectors.The fourth section, titled History of the Market, lists key milestones. In the 12th century in France, banks began regulating agricultural debts. In 1602 in Holland, the Dutch East India Company became the first to sell shares, marking the start of global stock trading. In 1698 in London, John Castaing listed stock prices, beginning the London Stock Exchange. In 1792 in New York, 24 brokers signed the Buttonwood Agreement, which grew into the New York Stock Exchange. In the 1830s, curbside trading in New York led to the American Stock Exchange. In 1896, Charles Dow published his first average. In 1971, Nasdaq launched as the first automated stock quotation system.The fourth section, titled History of the Market, lists key milestones. In the 12th century in France, banks began regulating agricultural debts. In 1602 in Holland, the Dutch East India Company became the first to sell shares, marking the start of global stock trading. In 1698 in London, John Castaing listed stock prices, beginning the London Stock Exchange. In 1792 in New York, 24 brokers signed the Buttonwood Agreement, which grew into the New York Stock Exchange. In the 1830s, curbside trading in New York led to the American Stock Exchange. In 1896, Charles Dow published his first average. In 1971, Nasdaq launched as the first automated stock quotation system.The sixth section, titled History of the Market, continues the timeline with four milestones. 1792, New York City. Twenty‑four brokers gathered under a buttonwood tree to sign an agreement establishing rules for buying and selling bonds and shares of companies. This group eventually became the New York Stock Exchange. In the 1830s, New York City traders began buying and selling the stocks of small, newly created enterprises in the street outside the New York Stock Exchange. These curbstone brokers eventually became the American Stock Exchange. 1896, New York City. Charles Dow calculated his first average, which eventually became the Dow Jones Industrial Average. 1971. The National Association of Securities Dealers—Nasdaq—went live with an automated quotation system for trading stocks. The illustration shows an antique stock‑ticker device under a glass dome.The sixth section, titled History of the Market, continues the timeline with four milestones. 1792, New York City. Twenty‑four brokers gathered under a buttonwood tree to sign an agreement establishing rules for buying and selling bonds and shares of companies. This group eventually became the New York Stock Exchange. In the 1830s, New York City traders began buying and selling the stocks of small, newly created enterprises in the street outside the New York Stock Exchange. These curbstone brokers eventually became the American Stock Exchange. 1896, New York City. Charles Dow calculated his first average, which eventually became the Dow Jones Industrial Average. 1971. The National Association of Securities Dealers—Nasdaq—went live with an automated quotation system for trading stocks. The illustration shows an antique stock‑ticker device under a glass dome.The fifth section, titled Markets of the World, highlights global stock exchanges by market capitalization. The New York Stock Exchange is the largest at $25.15 trillion. The Nasdaq Stock Exchange is listed at $18.99 trillion. The Shanghai Stock Exchange is $7.24 trillion.The fifth section, titled Markets of the World, highlights global stock exchanges by market capitalization. The New York Stock Exchange is the largest at $25.15 trillion. The Nasdaq Stock Exchange is listed at $18.99 trillion. The Shanghai Stock Exchange is $7.24 trillion.

Have A Question About This Topic?

Thank you! Oops!

Related Content

Should I Buy or Lease an Auto?

Should I Buy or Lease an Auto?

This calculator compares the financial impact of leasing versus buying an automobile.

Snapshots

Snapshots

Your life is marked by images. Prepare for the unexpected, so you can keep those pictures going.

Disability Income

Disability Income

This calculator estimates your chances of becoming disabled and your potential need for disability insurance.